React Native Testing: What 99.26% Line Coverage Measured
- John Adib
- 992 reads
A six-month testing push grew unit and device-flow inventories, while clearer coverage scope and CI runs made the 99.26% figure more useful.

A 99.26% line-coverage result can look like a verdict on an app’s reliability. In this React Native project, it was better understood as a scoped measurement and a CI guardrail—useful because the team also tracked which device flows actually ran and whether tests caught real defects.
When an engineering manager joined the consumer team in April, the app had 113 unit-test files and 14 Maestro YAML files. Device flows had existed for years, but CI didn’t run them. Mobile changes could bring nearby screens back into scope, prompting repeated checks near release without leaving an executable record for the next change. The team’s effort over the following six months changed both the volume of tests and how verification fit into development.
Testing moved into the definition of done
Starting in May, the team expected changes to production code to include relevant tests. The agent handling a task was expected to understand the requirement, make the change, write tests and run the repository checks before presenting its work. Putting tests beside implementation let developers and reviewers inspect the intended behavior while the details were still fresh.
Some practical choices helped keep that work manageable. Jest ran with jest-expo, and a shared render helper supplied the providers and routing used by the app. Business logic that didn’t require a screen could be tested in pure helpers. Controlled GraphQL responses let tests cover failure states without launching the full application. These techniques lowered the effort needed to write focused tests and maintain them as the app changed.
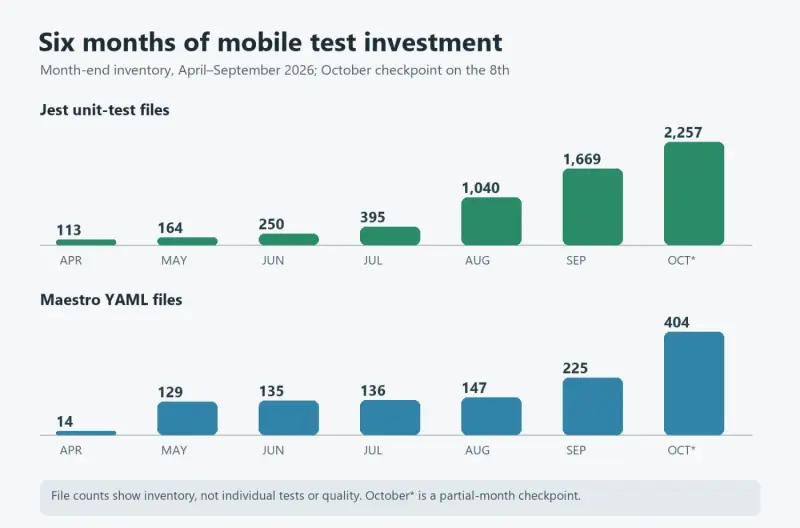
The unit-test file inventory grew from 164 at the end of May to 250 in June and 395 in July. It reached 1,040 in August, 1,669 in September and 2,257 at the October checkpoint. That’s a substantial expansion of the test suite, but file counts don’t say how many behaviors are protected: a file might contain one assertion or many, and splitting a file can increase the count without adding coverage.
Device flows needed a path into CI
Maestro files grew on a separate track. The inventory stayed at 14 through April, then reached 129 in May and 225 by the end of September. The October snapshot listed 404. Those files include individual flows, shared setup and suite entrypoints, so the count doesn’t represent 404 separate user journeys.
More consequential than adding flows was wiring them into execution. The first EAS device workflow arrived in May. Pull request smoke runs and nightly Maestro Cloud runs followed in June, so a flow in the repository could start producing a result during development.
That change also made the remaining gap concrete. In October, all 99 non-exempt product routes could be reached through leaf flows in the repository, but CI ran leaf flows that reached only 28. Having a flow for a route and running that flow automatically are different stages of coverage. The report exposed where further work could extend CI execution.
What the coverage percentage included
The October line-coverage report combined results from four Jest shards. Within the configured scope, tests covered 22,903 of 23,072 eligible lines, producing the 99.26% result. Branch coverage was 95.55%, a separate measure that helps show whether tests exercised different outcomes at decision points.
The team also made the measurement’s scope more explicit. Test helpers, Storybook, development-only code and other excluded files were removed from the production-code denominator. That made the percentage more relevant to the question it was meant to answer, while making clear why coverage numbers need their scope attached: a percentage alone can give a reviewer the wrong impression of what was measured. CI thresholds were pinned to the October baseline to keep later changes from quietly lowering that measure.
High coverage still needs meaningful assertions
Line coverage records whether execution reached code. It doesn’t establish that a test would catch a defect. For a regression, the more persuasive check is a test that fails with the old bug and passes with the fix.
In one review, two defects had survived earlier checks. The team temporarily reverted the fixes, then ran the new specifications; both tests failed for the original reasons. That showed the tests were sensitive to the defects in a way a high line-coverage number couldn’t.
Jest results also couldn’t show how an interaction behaved on an iOS or Android device. For changed interactions, the team brought device runs, screenshots and recordings into review, with results tied to the code revision under assessment. Those artifacts answered questions about rendered behavior that unit coverage wasn’t designed to answer.
Six months after the process began, the larger test inventory and the October coverage figure gave the team a demanding CI guardrail. The useful review questions remained more specific: which behaviors did the tests check, which device paths actually ran, and what still required human assessment? The percentage mattered most as a prompt to ask them—and as a measure whose scope and limits were clear. The case study and talk materials are available at Beyond the QA Bottleneck and the React Native London presentation.